

November 19, 2026

The Android Play developer console ships with a quality-monitoring suite most developers ignore until it hurts them: Android vitals, pre-launch reports, and the device catalog. Here’s what many don’t realize — Google uses your vitals data in ranking. Apps that cross the bad-behavior thresholds for crashes and ANRs get demoted in search and browse. Quality isn’t just user experience; it’s discoverability.
In short: Android vitals directly affect your Play Store ranking, so treat quality as discoverability. Keep crash rates below about 1.09 percent of sessions and ANR rates below about 0.47 percent, set vitals alerts, gate every release promotion on a clean pre-launch report, and use the device catalog to isolate device-specific problems.
This guide covers the quality side of the console in depth: what vitals measure and the exact thresholds, how to read and act on pre-launch reports, managing the device catalog, and the crash-fixing workflow that keeps you above the thresholds. For the publishing pipeline, see our Play Store dev console guide.
Console path: Quality → Android vitals.
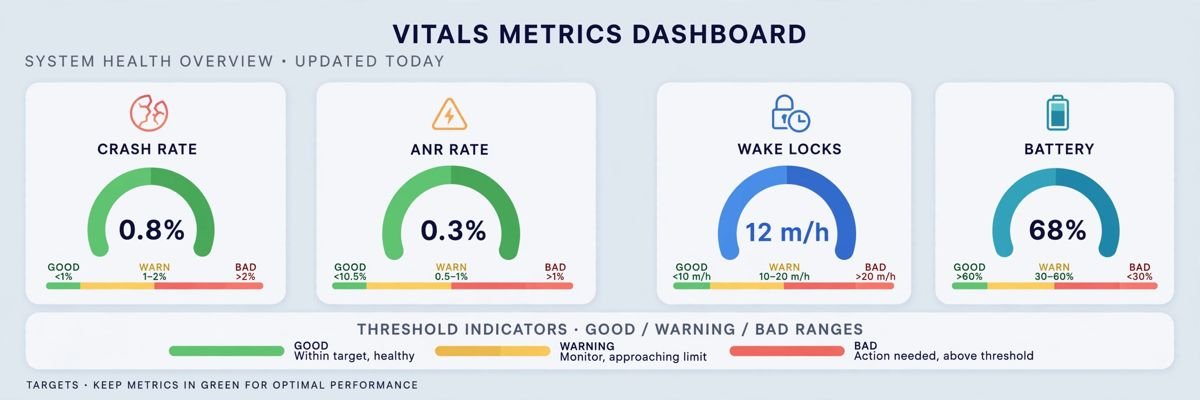
Vitals tracks three core metrics against Google’s bad-behavior thresholds:
Percentage of daily sessions ending in a crash. The bad-behavior threshold sits around 1.09% of sessions (Google adjusts it periodically — check the vitals page for the current figure). Cross it and your app is flagged; sustained violation affects discoverability.
Percentage of sessions with an ANR — the infamous “app isn’t responding” dialog. Threshold is around 0.47% of daily sessions. ANRs usually come from doing heavy work on the main thread: network calls, database queries, or image decoding blocking the UI.
Background battery abuse. Less visible to users than crashes but flagged in vitals and increasingly enforced.
How to read the dashboard: vitals shows your rate vs. the threshold as a timeline, broken down by app version, device, and Android version. The breakdowns are the diagnostic gold — a crash rate that’s fine overall but terrible on one device model points at a device-specific issue (GPU driver, manufacturer skin), not your code generally.
The table below summarises the core vitals metrics and their thresholds:
| Metric | Bad-behaviour threshold | Notes |
|---|---|---|
| Crash rate | Around 1.09% of daily sessions | Percentage of daily sessions ending in a crash; sustained violation affects discoverability |
| ANR rate | Around 0.47% of daily sessions | Percentage of sessions with an “app isn’t responding” dialog, usually from heavy work on the main thread |
| Excessive wakeups and stuck partial wake locks | Flagged in vitals | Background battery abuse; less visible to users than crashes but increasingly enforced |
Console path: Quality → Android vitals → Manage alerts (bell icon).
Configure alerts for:
Route alerts to the email (or group alias) your on-call developers actually read, plus enable push via the Play Console mobile app. The difference between catching a crash spike at hour 2 vs. day 3 is often a full star of rating.
Console path: Quality → Pre-launch report (generated automatically for every AAB uploaded to any track).
Every upload gets robo-tested on roughly 10 real device models in Google’s lab. The report includes:
Workflow: make the pre-launch report a release gate — no promotion from closed to open testing (or to production) until the report is clean or its findings are triaged. The most valuable catches are device-specific crashes you’d never reproduce on your own Pixel: Samsung-specific WebView quirks, Xiaomi background restrictions killing your service, foldable layout breaks.
Pro tip: the crawler can’t log in. If your app requires authentication, provide demo credentials in the pre-launch report settings so the crawler tests behind the login wall — otherwise half your app goes untested.
Console path: Quality → Device catalog (and Reach and devices).
The catalog lists every device model your app supports, with per-device install and vitals data. Use it to:
Caution: exclusions reduce your addressable market and can look like you’re hiding from bad reviews if overused. Exclude for genuine incompatibility, not to dodge vitals thresholds — Google sees through that.
When vitals flags an issue:
For release-track mechanics, see our release management guide.
Quality metrics gate more than ranking — they affect program eligibility:
Treat vitals as a product requirement, not a dashboard — “ship only when crash-free sessions exceed 99.5%” belongs in your definition of done alongside feature completeness. Our publishing pipeline guide shows where the quality gates fit in the release sequence.
Google’s official vitals documentation lives in the Play Console Help Center.
The table below summarises the quality benchmarks given above:
| Metric | Benchmark |
|---|---|
| Crash-free sessions | Top apps run 99.5%+; below 99% is the danger zone |
| ANR-free sessions | Target 99.5%+ |
| Startup time | Under 2 seconds cold start on mid-range devices; over 5 seconds bleeds users |
| APK/AAB size | Every 6MB of size costs roughly 1% of installs (Google’s own data) |
The Android Play developer console quality suite — vitals with ranking-linked thresholds, free pre-launch device testing, and the device catalog — makes quality measurable and actionable. Set vitals alerts today, gate every promotion on pre-launch reports, and treat threshold crossings as P0 incidents. Quality isn’t just UX; it’s discoverability.
Google’s published limits for crash rate (~1.09% of daily sessions), ANR rate (~0.47%), and background battery abuse. Crossing them flags your app in the console and can reduce your discoverability in Play Store search and browse. Check Quality → Android vitals for current figures.
Yes. Google has confirmed that technical quality signals — primarily crash and ANR rates vs. thresholds — feed into ranking. An app with a 3% crash rate will rank below an equivalent-quality app at 0.2%, all else equal.
An automated test report generated for every AAB upload: Google’s robo-crawler runs your app on ~10 real devices and reports crashes, screenshots, performance, accessibility, and security issues. It’s free — use it as a release gate before every promotion.
Quality → Device catalog, find the device, and set it to Excluded. Use this for genuine incompatibility (broken drivers, missing hardware), not to hide from bad vitals — and remember exclusions shrink your market.
Device-specific issues: GPU driver bugs, manufacturer Android skins, aggressive background killers (common on some Chinese OEMs), or foldable form factors. Use the vitals version/device breakdown to isolate, then exclude or work around the specific device.
The Android Play developer console’s quality tools — vitals with its ranking-linked thresholds, free pre-launch device testing, and the device catalog — turn quality from a vague aspiration into measured, alerted, actionable work. Set up alerts today, gate releases on pre-launch reports, and treat threshold crossings as the P0 incidents they are.
Play Console Store is an independent marketplace helping Android developers with quality monitoring, crash triage, and vitals recovery. Explore our Google Play services to keep your metrics green.