

November 5, 2026

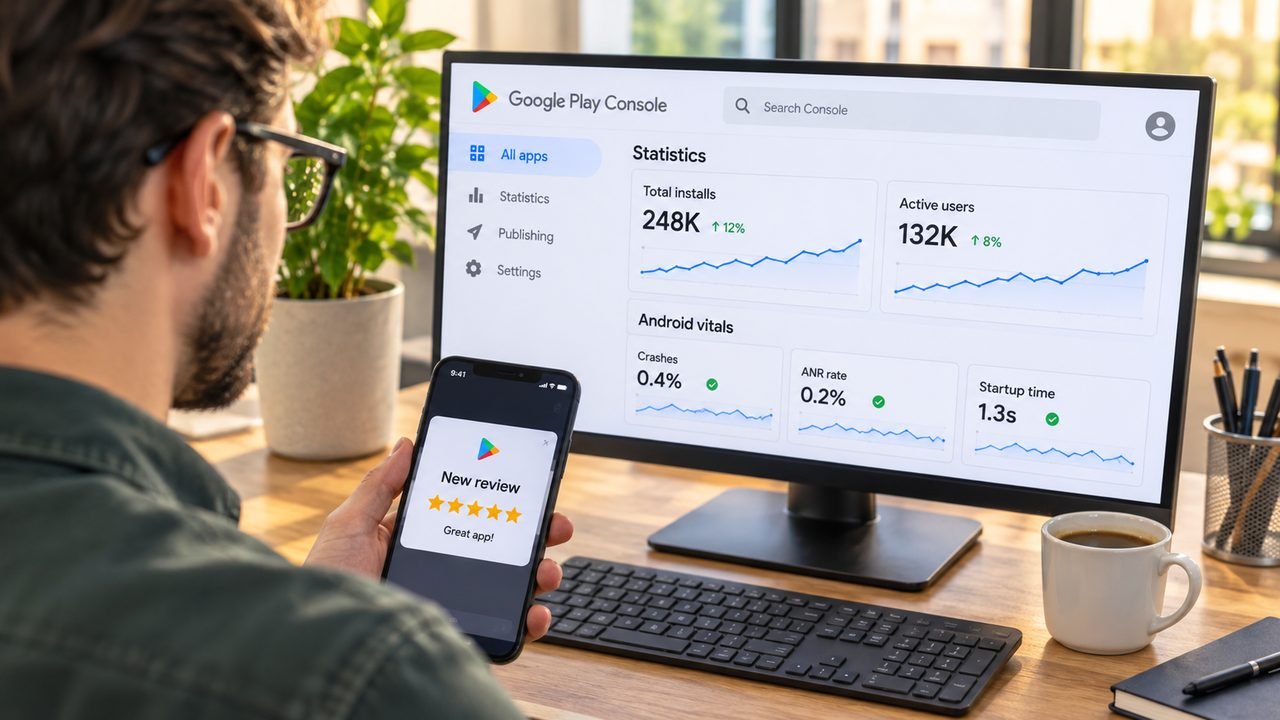
Managing an Android application involves much more than writing code and publishing it on the Google Play Store. Developers must monitor app performance, manage releases, review user feedback, resolve technical issues, and maintain compliance with Google Play policies. Keeping track of all these activities can become challenging without the right management tools.
The Play Console Dashboard makes this process easier by providing developers with an overview of important app information, setup tasks, performance metrics, and operational insights. It helps developers understand their application’s current status and identify areas that require attention.
Whether you are launching your first Android application or managing multiple published apps, understanding the Play Console Dashboard can improve your development workflow and make app management more organised.
In this guide, we will explain what the Play Console Dashboard is, how it works, its essential features, how to monitor important metrics, and how developers can use it to manage their applications more effectively.
The Play Console Dashboard is the main overview area within Google Play Console where developers can access important information about an individual Android application.
It provides a central place to review app setup tasks, publishing progress, performance trends, notifications, and useful insights.
When developers create a new application, the dashboard guides them through the steps required to prepare it for publication. After the application is launched, it can display performance information and help developers monitor its ongoing progress.
Some of the main activities developers can manage or review through the Play Console Dashboard include:
In simple terms, the Play Console Dashboard works as an operational starting point for developers who want to manage their Android applications efficiently.
An Android application requires continuous attention after publication. Developers need to understand how users interact with their apps, identify problems, and make improvements based on real performance data.
The Play Console Dashboard helps organise this work by bringing important information together.
Developers can access important application information from one place instead of navigating through different sections every time they need an update.
The dashboard highlights selected metrics and trends that help developers understand how their applications are performing.
For applications that have not yet launched, the dashboard provides setup tasks and publishing guidance.
Developers can use dashboard insights and links to detailed reports to investigate technical or policy-related problems.
Performance data helps development teams decide which areas need improvement, whether that means fixing crashes, improving the store listing, or updating app features.
Using the Play Console Dashboard regularly can make application management more organised and help developers respond to problems before they become bigger issues.
The dashboard includes several useful features designed to support different stages of an application’s lifecycle.
Understanding these features helps developers use the platform more effectively.
When you create a new application, the dashboard provides a guided setup process.
It displays the tasks that need to be completed before the app can become available on Google Play.
These tasks may include:
As you complete the required tasks, the dashboard updates the progress indicators.
This makes it easier to identify outstanding requirements and prepare your application for launch.
After an application has been published, the Play Console Dashboard can display key performance metrics and trends.
Depending on the available data, developers may see information related to:
The information displayed can vary depending on the app, reporting period, and available data.
Developers can use this overview to understand whether their application is attracting users and how its performance changes over time.
One useful feature of the Play Console Dashboard is the ability to select and pin important metrics in the Monitor trends section.
This allows developers to focus on the indicators that matter most to their applications.
For example, a developer may want to monitor:
To customise this section:
Your selected metrics help create a more relevant overview of app performance.
Publishing an application requires careful planning and testing.
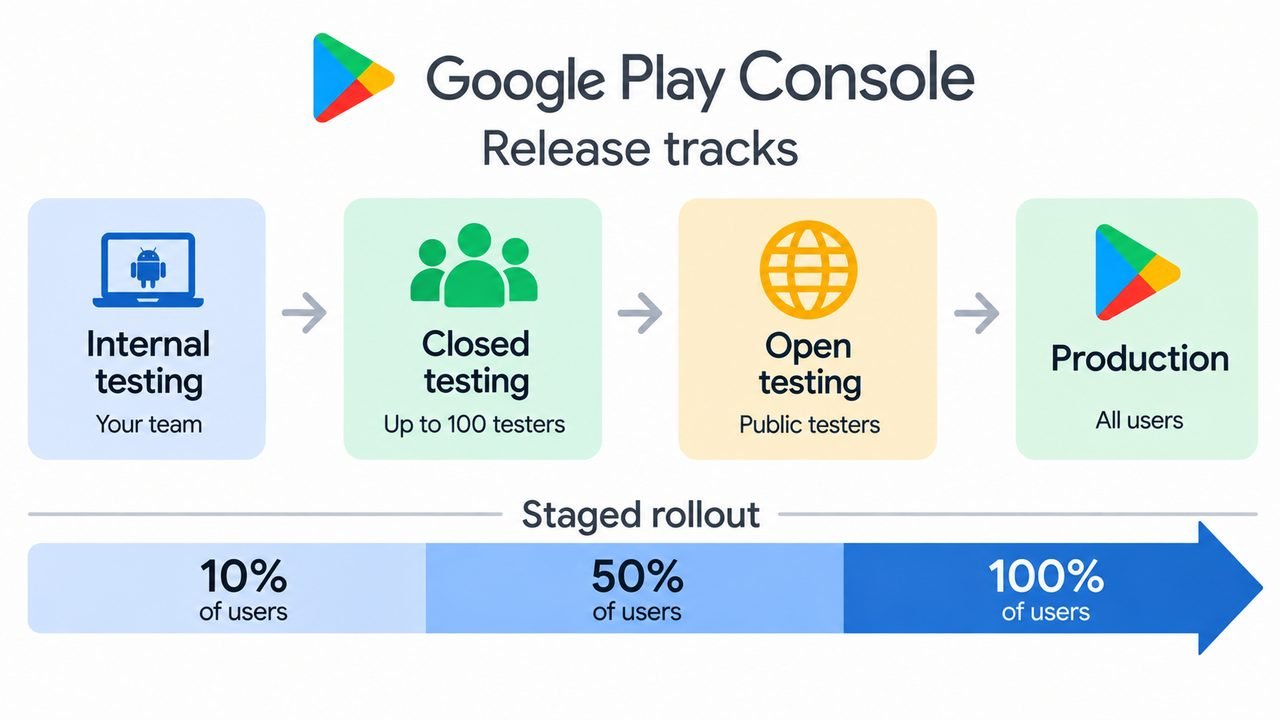
The dashboard helps developers access relevant setup and release workflows, including testing and production publishing tasks.
Developers can use different testing tracks to distribute applications to selected audiences before making them publicly available.
These include:
Testing helps developers identify bugs, improve functionality, and collect feedback before a public launch.
The Play Console Dashboard can highlight relevant notifications, performance trends, and insights.
These notifications help developers identify areas that may require investigation or action.
For example, a developer may need to review an app setup task, investigate a release issue, or examine a change in performance.
Checking these insights regularly can help prevent important tasks from being overlooked.
Accessing the Play Console Dashboard is straightforward.
Follow these steps to find your application dashboard.
Visit the official Google Play Console website and sign in using your registered developer account.
After signing in, choose the Android application you want to manage.
If you have multiple applications, make sure you select the correct one.
Find Dashboard in the left-hand navigation menu and click it.
You will now see the main overview for your selected application.
Check the available sections, including setup progress, performance information, notifications, and trends.
Many dashboard sections include links to more detailed reports.
Use these links when you need additional information about a particular metric or issue.
Following these steps regularly can help you stay informed about your application’s current status.
Monitoring the right metrics is essential for understanding app performance.
Although the dashboard provides an overview, developers should also use the detailed Statistics and Android vitals sections when they need deeper insights.
Here are some important metrics to understand.
Install and acquisition information helps developers understand how many users are discovering and installing their applications.
Tracking this information can help identify changes in app growth and evaluate marketing activities.
If acquisition numbers decrease, developers may need to review their store listing, app visibility, or promotional campaigns.
Active user metrics help developers understand whether people continue using their applications.
A high number of installs does not necessarily mean users regularly engage with an app.
Monitoring available active user metrics can help identify opportunities to improve retention and user experience.
Store listing conversion helps developers understand how effectively their app listing turns visitors into installers.
A low conversion rate may indicate that the app description, screenshots, icon, or overall presentation needs improvement.
Consider testing clearer descriptions, more informative screenshots, and stronger explanations of your app’s benefits.
Crashes occur when an application unexpectedly stops working.
A high crash rate can damage user experience and lead to negative reviews.
Developers should investigate crash reports, identify affected devices, and release fixes when necessary.
ANR stands for Application Not Responding.
An ANR occurs when an application fails to respond within the expected time.
Frequent ANR problems can frustrate users and negatively affect app quality.
Monitoring ANR information through Android vitals helps developers identify and investigate these problems.
Ratings and reviews provide insight into user satisfaction.
Pay attention to recurring complaints, feature requests, and feedback about usability.
Responding professionally and resolving common issues can help improve the overall experience.
For apps that generate income, revenue reports can help developers understand financial performance.
Depending on the app’s monetisation model, revenue may come from paid downloads, subscriptions, or in-app purchases.
Review revenue trends alongside user activity to understand how your monetisation strategy is performing.
Simply checking numbers is not enough. Developers should use dashboard information to make practical improvements.
Here are some ways to turn insights into action.
Review your selected KPIs regularly and compare current performance with previous periods.
Look for sudden increases or decreases that may require investigation.
Use Android vitals to investigate crashes, ANRs, battery-related issues, and other technical quality problems.
Prioritise issues that affect a large number of users or specific device models.
If your app receives store listing visitors but has a low conversion rate, review your app icon, screenshots, title, and description.
Make sure the listing communicates the application’s main benefits clearly.
Read reviews and identify repeated problems.
If multiple users report the same issue, investigate it and consider including a fix in your next update.
After publishing an update, monitor release performance and technical metrics.
A staged rollout can help identify problems before the update reaches a larger audience.
Do not ignore dashboard alerts or outstanding setup tasks.
Investigate important notifications and follow the relevant instructions to resolve issues.
Combining these activities makes the Play Console Dashboard more useful as part of your daily app management process.
Developers sometimes confuse the dashboard with the Statistics section. Although both help monitor app performance, they serve different purposes.
| Feature | Play Console Dashboard | Statistics |
|---|---|---|
| Main purpose | App overview | Detailed performance analysis |
| Key metrics | Selected KPIs and insights | Customisable metrics and dimensions |
| Performance trends | Quick overview | Deeper trend analysis |
| Data comparison | Summary information | Custom date ranges and peer comparisons |
| Main use | Daily monitoring | Detailed investigation |
| Best for | Quick operational decisions | Data-driven analysis |
The Play Console Dashboard helps developers understand what is happening with their application at a glance.
The Statistics section is more suitable when you need to investigate specific metrics, compare time periods, or analyse performance in greater detail.
Both sections work together to support better app management.
Developers may occasionally experience difficulties when managing their applications.
Understanding common problems can make troubleshooting easier.
A newly created app may display outstanding tasks even when some information has already been provided.
Solution: Open the relevant task, review its requirements, and complete any missing information. Some tasks may require additional processing before their status updates.
A new application may not immediately display all performance information.
Solution: Allow time for data collection and reporting. Some metrics require sufficient data before they become available.
Not every metric is available for every app or dashboard configuration.
Solution: Use the Add your KPIs option to review available metrics. For more detailed analysis, visit the Statistics section.
A sudden drop in installs, engagement, or another metric may indicate a change in user behaviour or app performance.
Solution: Compare reporting periods, review relevant events, check store listing performance, and investigate technical reports.
Crashes, ANRs, and performance issues can make an application difficult to use.
Solution: Open Android vitals, review the available issue details, and work with your development team to fix the underlying problems.
An app may receive policy notifications that require developers to take action.
Solution: Visit the Policy status section, review the specific issue, and follow Google’s instructions for resolving it.
To get the most value from your dashboard, make it part of your regular development workflow.
Follow these practical recommendations:
1. Check Your Dashboard Regularly: Review important updates, notifications, and performance trends instead of waiting until a problem occurs.
2. Customise Your KPIs: Pin the metrics that directly relate to your app’s goals.
3. Monitor Android Vitals: Review crash rates, ANRs, and other technical quality indicators.
4. Keep Your App Updated: Release improvements and bug fixes when needed, and test updates before wider distribution.
5. Review User Feedback: Use ratings and reviews to identify areas where the app can improve.
6. Investigate Performance Changes: Compare different reporting periods to understand significant changes.
7. Follow Google Play Policies: Check policy notifications and keep app declarations accurate.
8. Use Detailed Reports: Do not rely only on the dashboard when investigating complex issues. Open the relevant reports for additional information.
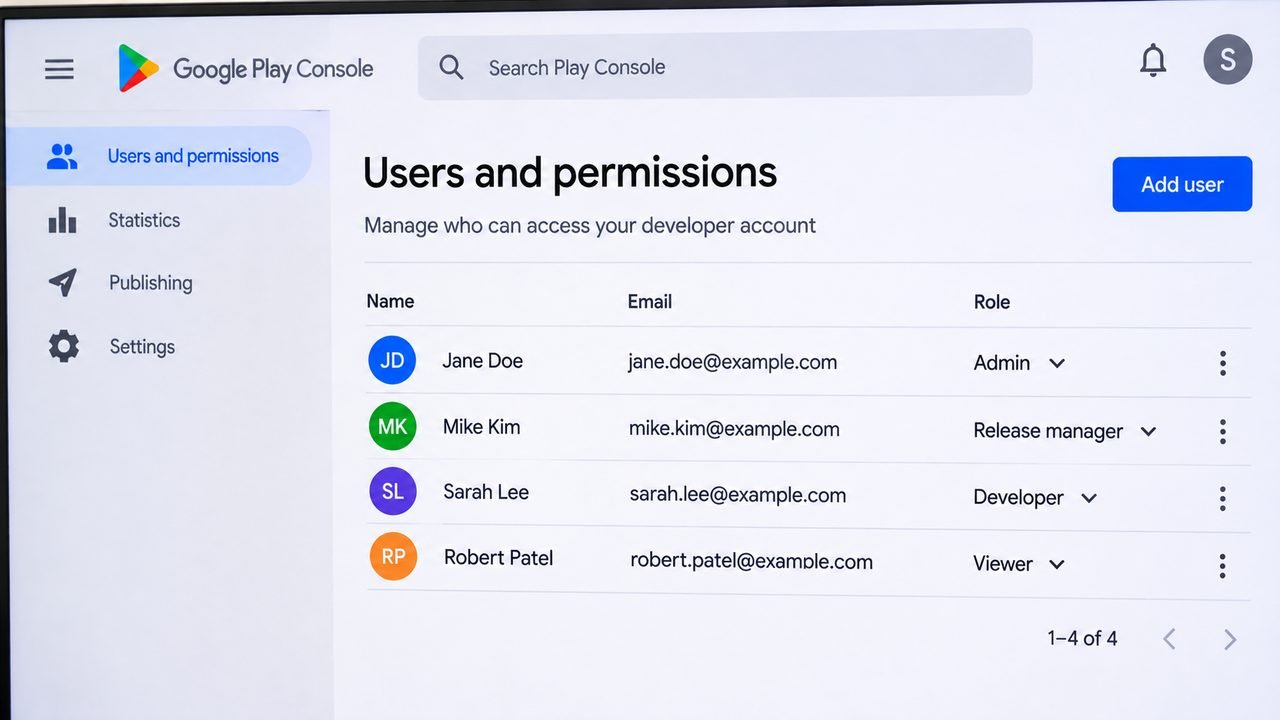
9. Assign Clear Responsibilities: Make sure someone on your team is responsible for reviewing performance, releases, and policy issues.
10. Document Important Changes: Keep records of releases and major updates so you can compare changes with later performance trends.
The Play Console Dashboard is an important operational tool for Android developers who want to manage their applications efficiently. It provides a central overview of app setup tasks, publishing progress, performance trends, notifications, and selected metrics.
By using its features regularly, developers can identify problems, monitor important KPIs, improve app stability, and make better decisions about future updates.
However, the dashboard should not be your only source of information. Combining it with detailed Statistics reports, Android vitals, release monitoring, and user feedback gives you a clearer understanding of your application’s overall health.
Whether you are managing a new app or maintaining an established Android product, making the Play Console Dashboard part of your daily workflow can help you stay organised and improve long-term app performance.
Play Console Dashboard is the main overview section of Google Play Console. It helps developers monitor application setup, publishing tasks, performance metrics, trends, notifications, and important insights.
Sign in to Google Play Console, select your application, and click Dashboard in the left-hand navigation menu.
The dashboard is part of Google Play Console. Developers must register for a Google Play developer account and pay the applicable registration fee to publish apps. The dashboard itself does not have a separate usage fee.
Depending on your app and available data, you can monitor selected KPIs relating to installs, users, revenue, ratings, and other performance indicators. Detailed reports provide additional information.
Yes. Developers can select and pin available metrics in the Monitor trends section using the Add your KPIs option.
Dashboard provides an overview of key metrics, trends, and insights. Statistics provides more detailed reports with customisable metrics, dimensions, and date ranges.
New apps or apps with limited activity may not have enough data for certain reports. Some metrics also have reporting delays or availability requirements.
It highlights important trends and provides links to detailed reports. Developers can use this information to investigate technical problems, improve store listing conversion, and make better release decisions.
Android vitals is a reporting tool that helps developers monitor technical quality, including crashes, ANRs, battery usage, and other performance indicators.
Developers should review their dashboard regularly. Daily checks can be useful for actively maintained or high-traffic apps, while smaller applications may benefit from a consistent weekly review schedule.
Yes. Developers can manage multiple applications through one developer account, provided they have the appropriate access permissions. Each application has its own dashboard and reports.
The dashboard can surface relevant tasks and notifications. Developers can use the Policy status section for detailed information about policy compliance and any actions required.